
 Dashboard
Part of: South Africa Elections

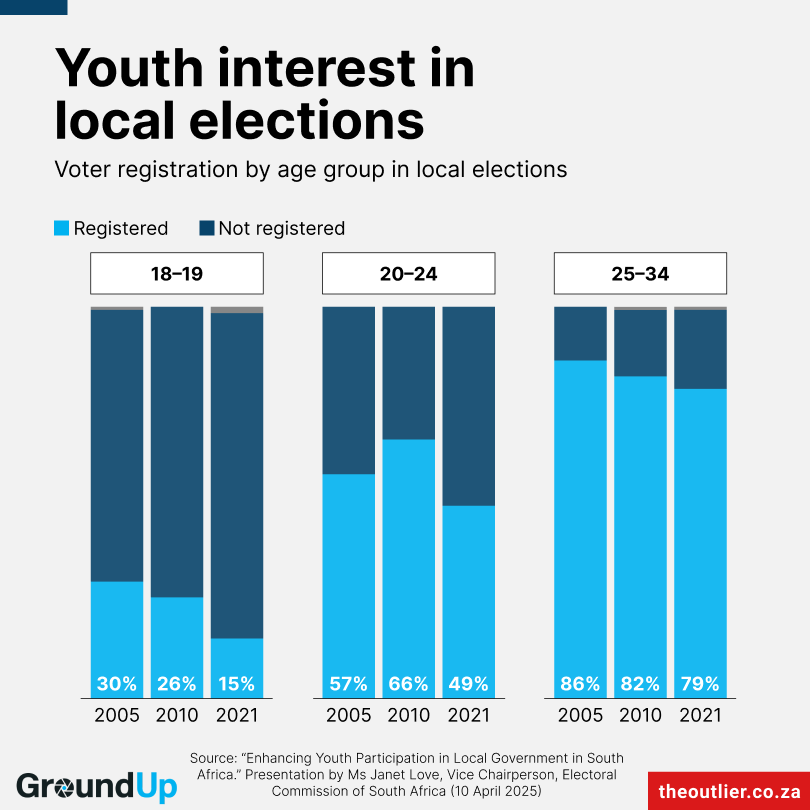
This chart is one possible view of this dataset — you'll find other chart options below if they are available. You can find the full dataset and metadata at the bottom of the page.
These charts are based on dataset DS0391 - Youth voter registration rate in South Africa
Youth voter registration self-reporting rates in South Africa across three survey years (2005, 2010, and 2021). The dataset breaks down registration status (registered, not registered, and undisclosed) across three youth age brackets: 18-19, 20-24, and 25-34. Based on research presented by the Electoral Commission of South Africa (IEC).
- Time period covered
- 2005 to 2021
- Geographic coverage
- South Africa
- Source
- Electoral Commission of South Africa
Preview the full dataset below.
| year | age_group | registered | not_registered | do_not_know_refused_% |
|---|---|---|---|---|
| 2005 | 18–19 | 30 | 69 | 1 |
| 2005 | 20–24 | 57 | 43 | 0 |
| 2005 | 25–34 | 86 | 14 | 0 |
| 2010 | 18–19 | 26 | 74 | 0 |
| 2010 | 20–24 | 66 | 34 | 0 |
| 2010 | 25–34 | 82 | 17 | 1 |
| 2021 | 18–19 | 15 | 83 | 2 |
| 2021 | 20–24 | 49 | 51 | 0 |
| 2021 | 25–34 | 79 | 20 | 1 |