
 Dashboard
Part of: Tertiary education in South Africa



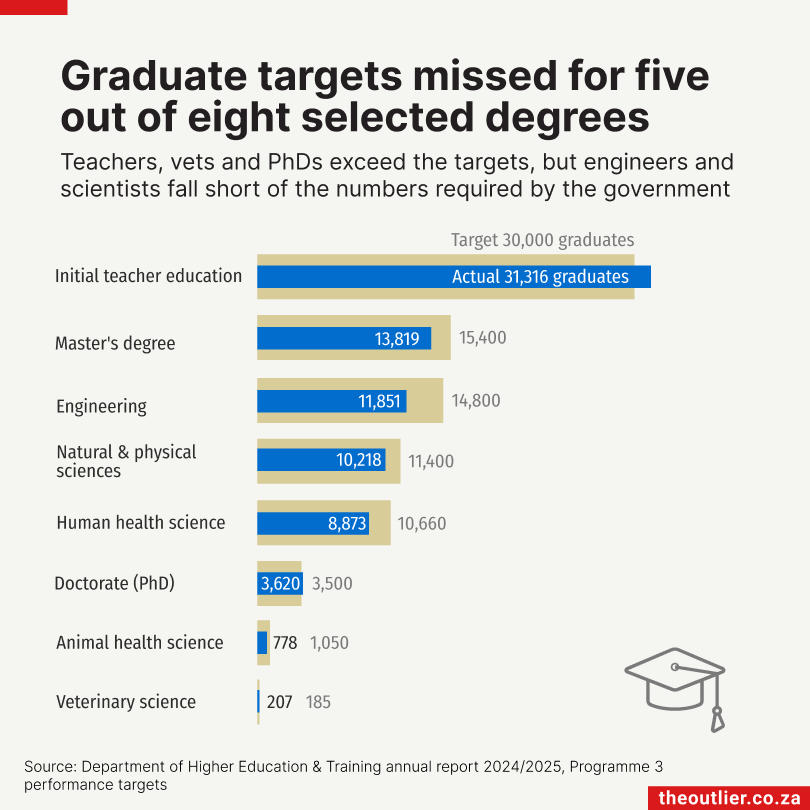
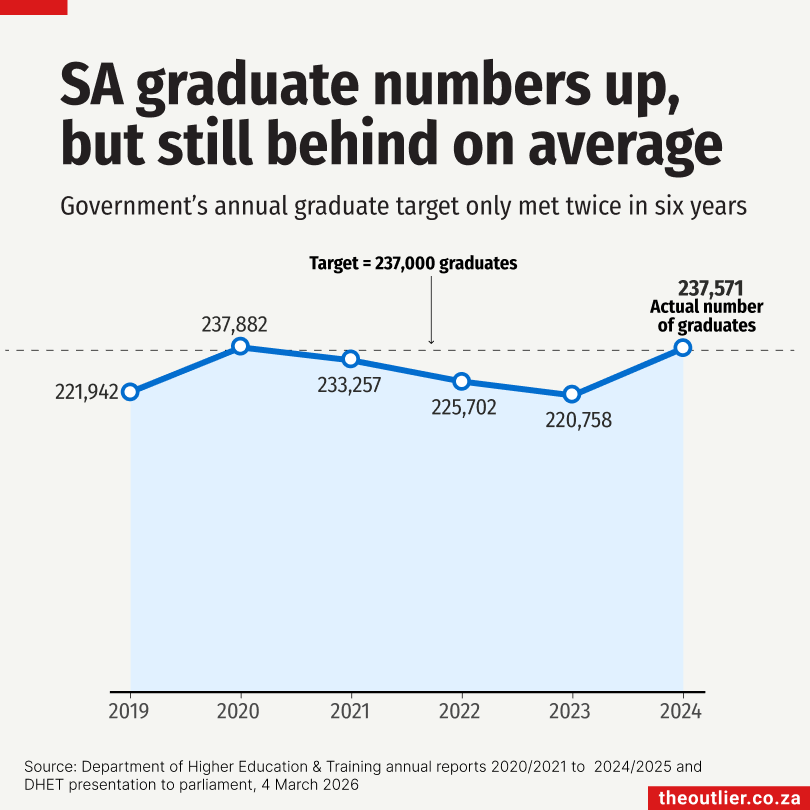
This chart is one possible view of this dataset — you'll find other chart options below if they are available. You can find the full dataset and metadata at the bottom of the page.
These charts are based on dataset DS0362 - Annual public university graduate numbers, South Africa
The annual number of graduates from South Africa's public universities covering eight key areas: engineering, natural and physical sciences, human health sciences, animal health sciences, veterinary sciences, initial teaching education, masters degrees and doctorates (all subjects). The data comes from the Department of Higher Education and Training's annual reports, except for the 2024 data, which was sourced from a DHET presentation to a parliamentary committee in March 2026.
- Time period covered
- 2019 to 2024
- Time-series breakdown
- Annual
- Geographic coverage
- South Africa
- Source
- Department of Higher Education and Training
Preview the full dataset below.
| year | graduates | students_enrolled | engineering | natural_and_physical_sciences | human_health_science | animal_health_science | initial_teacher_education | veterinary_science | master’s | doctorate |
|---|---|---|---|---|---|---|---|---|---|---|
| 2019 | 221942 | 1074912 | 13714 | 9121 | 28335 | - | 13519 | 3445 | ||
| 2020 | 237882 | 1094808 | 12652 | 9642 | 9646 | 867 | 30809 | 208 | 12922 | 3552 |
| 2021 | 233257 | 1068046 | 12605 | 10608 | 9558 | 1509 | 29925 | 219 | 13796 | 3574 |
| 2022 | 225702 | 1077768 | 11936 | 9702 | 9689 | 814 | 31080 | 199 | 13765 | 3690 |
| 2023 | 220758 | 1071715 | 11851 | 10218 | 8873 | 778 | 31316 | 207 | 13819 | 3620 |
| 2024 | 237571 | 1133868 | 10805 | 10960 | 8663 | 1042 | 31657 | 203 | 14726 | 4010 |