Featured Datasets
Recent
View all →- Cost of Household Food Basket in different areas
- Voter registration, turnout in local government elections, municipality level, South Africa
- Producer Price Inflation (PPI)
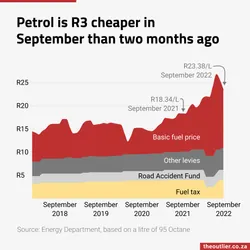
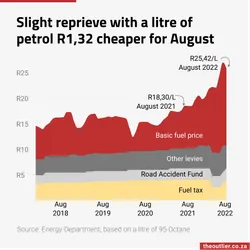
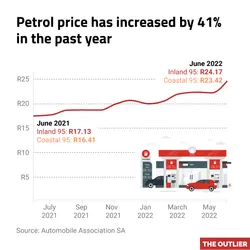
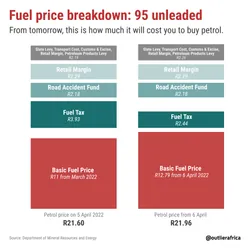
- Petrol price in South Africa since 2006
- GDP per capita (world)
- People employed by sector in South Africa, by quarter
-
The South African prime lending rate as set by the South African Reserve Bank. Data is daily lending rate.
DS0388 Economy & BusinessCoverage:
-
The Rand to Dollar exchange rate per day, which is a weighted average of the banks' daily rates at approximately 10:30 am. Weights are based on the banks' foreign exchange transactions.
DS0331 Economy & Business south africacurrencyCoverage:
- Cost of Household Food Basket in different areas
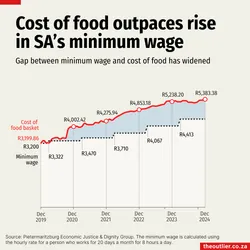
Description: The monthly cost of a basket of food that a low-income South African household of seven people typically tries to buy each month. The basket was designed by the Pietermaritzburg Economic Justice & Dignity Group (PMBEJD) with women living on low incomes, based on the foods and quantities they say they aim to secure. It contains 44 food items. It reflects what households actually buy under tight budgets, not an ideal diet, and is not nutritionally complete. Women shoppers collect the prices from the supermarkets and butcheries that serve low-income areas, and it reflects their choices in switching to cheaper brands or stores in order to find specials, meaning the data represents what households really pay each month. This data is published monthly as part of the Household Affordability Index.
DS0467 Economy & Business food povertyfoodcost-of-livinggrocery-basketinflationCoverage:
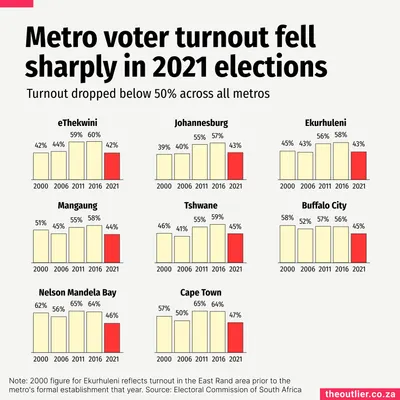
- Voter registration, turnout in local government elections, municipality level, South Africa
This dataset contains the number of registered voters, the number who voted (voter turnout) and the percentage who voted (%voter turnout) in each of South Africa's local municipalities in five local government elections - 2000, 2006, 2011, 2016 and 2021. Elections are held every five years. Only registered voters can vote.
DS0376 Politics & Elections electionssouth africaCoverage: - Producer Price Inflation (PPI)
South African annual price inflation (PPI), monthly.
DS0466 Economy & Business south africaproducer price inflationinflationCoverage:
-
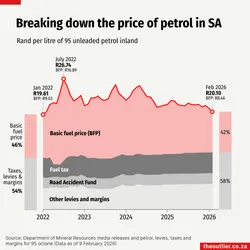
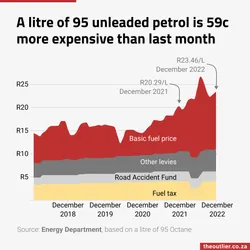
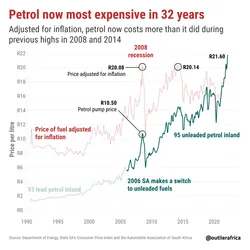
The basic fuel price per month for a litre of 95 octane inland, including various taxes levied. Data starts 2006.
DS0150 Economy & Business south africapetrolCoverage:

- GDP per capita (world)
Gross Domestic Product (GDP) per capita in current US dollars for all countries and various regional and economic groups. Gross domestic product is the total income earned through the production of goods and services in an economic territory during an accounting period (in this case, annually). Here it has been divided the general population of each country / group to achieve a per capita estimate. The values are expressed in 'current' (also known as 'nominal') prices, meaning the values provided for each specific year reflects the prices of that year, without adjusting them to remove the effects of inflation over time. The values are expressed in United States dollars.
DS0301 Economy & Business gdpeconomic indicatorseconomyCoverage:
- People employed by sector in South Africa, by quarter
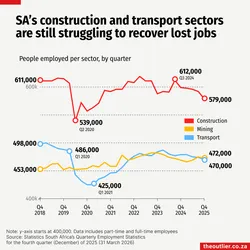
The number of people employed in South Africa in specific industries. The employment numbers in this dataset combine both part-time and full-time employees. The data is sourced from Statistics South Africa's Quarterly Employment Statistics (QES) in selected industries: The Quarterly Employment Statistics are the findings of an enterprise survey conducted by Stats SA based on samples drawn from private non-agricultural businesses (factories, firms, offices and stores), as well as from national, provincial and local government entities to measure employment figures
DS0334 Economy & Business employmentsouth africastatistics south africaworkforceCoverage:
-
Solar panel imports from China to South Africa (measured in megawatts), based on data from Ember, which sources it from the General Administration of Customs of the People’s Republic of China. Data is available from 2017.
DS0068 Energy chinasouth africasolarelectricityCoverage:


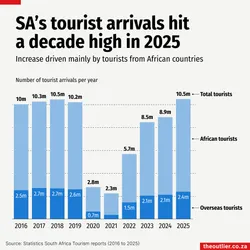
- Arrivals of tourists in South Africa, by month and major airport
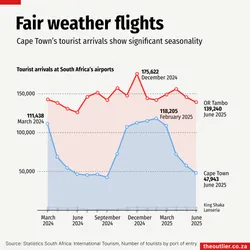
The number of tourists arriving in South Africa through one of the four major international airports OR Tambo, Cape Town, King Shaka and Lanseria by month.
DS0323 Transport & Infrastructure cape townjohannesburgsouth africatourismCoverage:
- Tourists arriving in South Africa, by month
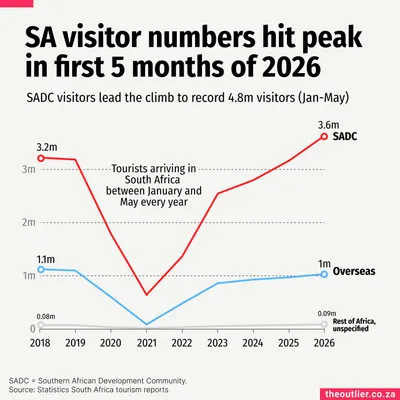
The number of tourists arriving in South Africa each month by air, sea and land
DS0146 Economy & Business tourismsouth africatravelarrivalsCoverage:
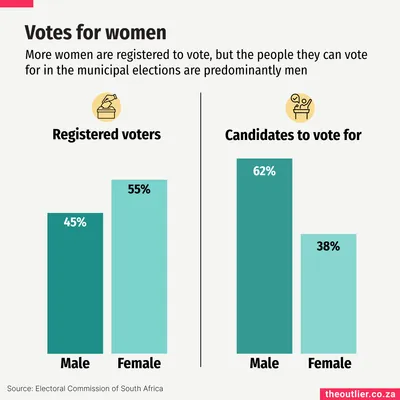
- Registered voters in South Africa's 2026 local government elections
This dataset contains the number of people registered to vote in the 2026 municipal elections broken down by sex and age categories as at 2 September 2026.
DS0411 Politics & Elections south africaelectionsmunicipalitiesvoter registrationlocal governmentCoverage:

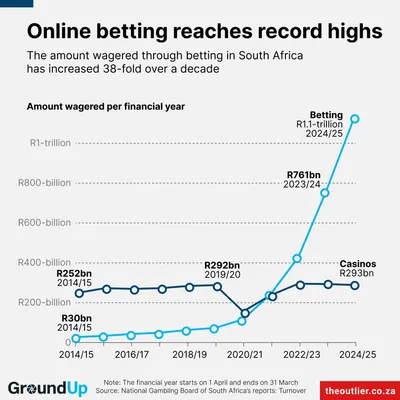
- Gambling turnover in South Africa
Annual rand value of total money wagered (turnover) in South Africa across financial years (1 April to 31 March). The dataset is segmented by gambling sector: casinos, betting, bingo, and limited payout machines (LPMs).
DS0329 Economy & Business south africagamblingCoverage:

- Eskom energy availability factor in South Africa, by week
Weekly Energy Availability Factor (EAF) percentage across Eskom power stations, representing the proportion of available generation capacity. Excludes electricity generated by independent power producers (IPPs), renewable energy sources, and imported power.
DS0199 Energy electricityeskomsouth africaenergy availability factorpower generationweekly dataCoverage:
- Labour absorption rate by province
The labour absorption rate is the proportion of the working-age population aged 15 to 64 years that is employed. It is also known as the employment-to-population ratio.
DS0107 Economy & Business employmentpopulationlabour absorption rateworkforceCoverage:
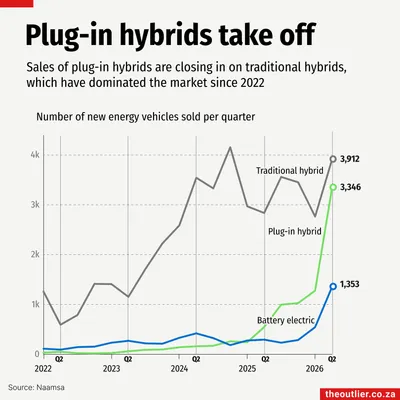
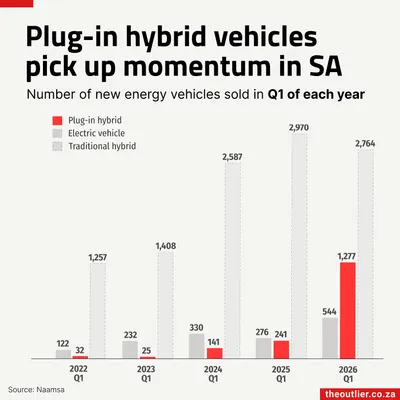
- New energy vehicle sales in South Africa
Sales numbers of plug-in hybrids, traditional hybrids and plug-in electric vehicles by financial quarter from 2022 in South Africa.
DS0367 Transport & Infrastructure south africaelectric vehicleshybrid vehiclesvehicle salesCoverage:
- GDP growth rate, annual, South Africa
South Africa's annual GDP growth rate (in constant 2015 prices) Gross domestic product is the total income earned through the production of goods and services during an accounting period. The GDP growth rate represents the percentage change over each previous year of the constant price.
DS0214 Economy & Business south africagdpeconomic growthCoverage:
-
Quarter on quarter pecent change in South Africa's gross domestic product. Constant 2015 prices, seasonally adjusted
DS0412 Economy & Business south africagdpeconomic growthCoverage:
- Solar panel imports from China into African countries
Cumulative generation capacity, measured in megawatts (MW), of solar photovoltaic panels exported from China to African countries.
DS0364 Energy africasolar energysolarrenewable energyrenewablesCoverage:
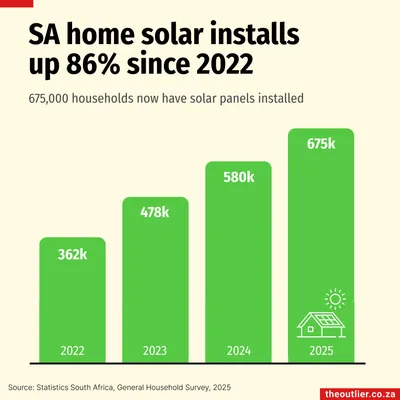
- South African households that have solar panels
The number of South African households that own one or more solar electric panels
DS0370 Energy south africasolarCoverage:
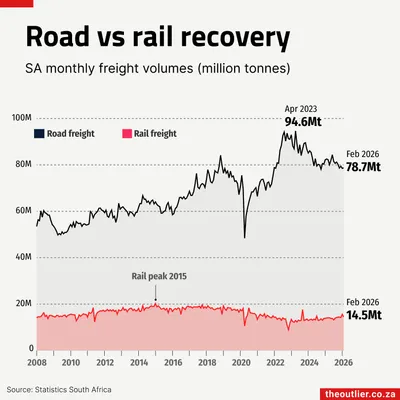
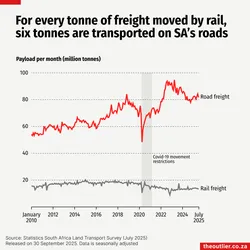
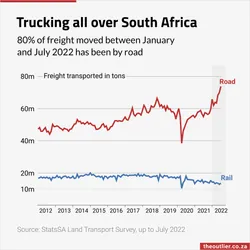
- Volume of freight moved by road and rail in South Africa
Monthly seasonally adjusted freight payload moved by road and rail, measured in metric tonnes. From Statistics South Africa's Land Transport Survey.
DS0126 Transport & Infrastructure road freightroad and railfreight transportland transportCoverage:
-
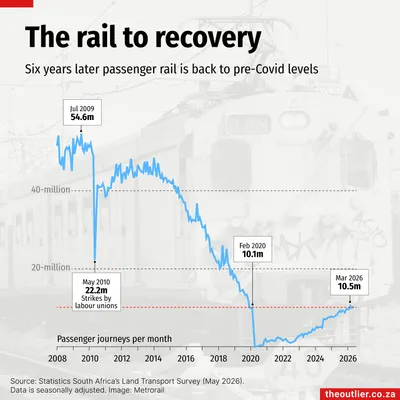
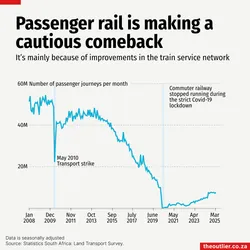
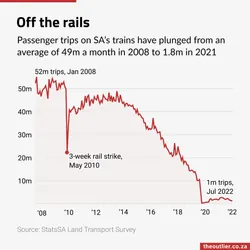
Monthly seasonally adjusted passenger rail journeys, measured in passenger trips.
DS0062 Transport & Infrastructure public transportrail transportpassenger journeysCoverage:
-
The total number of rhinos poached per year in South Africa, including a breakdown of rhinos poached in the game reserves run by South African National Parks (SANParks), eg, Kruger National Park, as well as rhinos poached in province-run and private game reserves by province.
DS0056 Climate & Environment south africawildliferhinopoachingCoverage:

- Consumer prices in South Africa
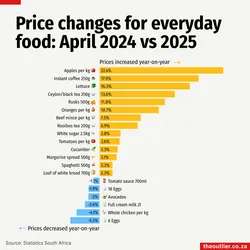
A list of food, baby, household and pet items surveyed by Statistics South Africa each month to determine the cost of living for people living in South Africa.
DS0165 Economy & Business cpisouth africastatistics south africaconsumer priceCoverage: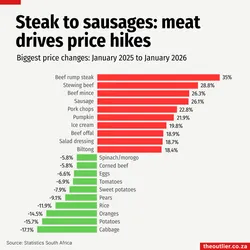
-
The consumer price index (CPI) is the official measure of inflation in South Africa. This dataset is updated monthly.
DS0128 Economy & Business cpiconsumer pricesouth africaCoverage:
- Eskom greenhouse gas emissions
Greenhouse gas emissions released by South Africa’s main electricity prducer, the state-owned utility Eskom. Emissions include total emissions as well as carbon dioxide (CO₂), methane (CH₄) and nitrous oxide (N₂O). Data is from the Draft 10th National Greenhouse Gas Inventory Report 1990-2024
DS0032 Climate & Environment eskomfossil fuelelectricitygreenhouse gasemissionsclimateCoverage:
- Population of South Africa's provinces by age - StatsSA
This dataset is from the Statistics South Africa's Mid-year Population Estimates 2026. It includes total population estimates for each province as well as estimates for 17 age cohorts for mid-2026
DS0419 Demographics & Society age cohortspopulation estimatesprovincialCoverage:

- Population of South Africa by age cohort - StatsSA
This dataset is from the Statistics South Africa's Mid-year Population Estimates 2026 dataset. It includes total population as well as estimates for 17 age cohorts for 2002 to 2026
DS0414 Demographics & Society population estimatesage groupsannual estimatesCoverage:
-
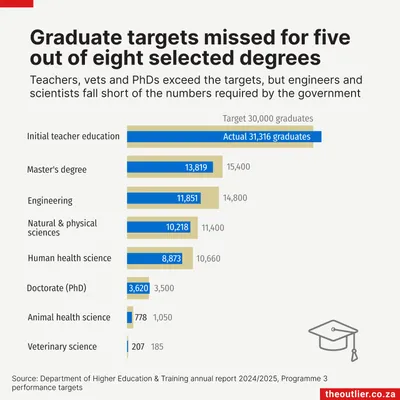
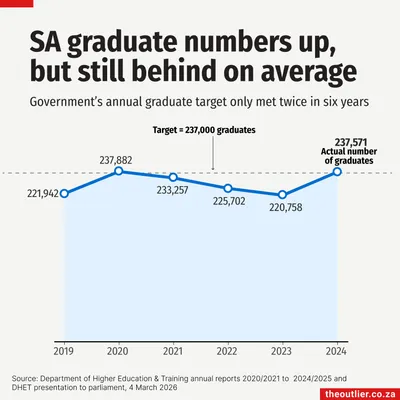
The annual number of graduates from South Africa's public universities covering eight key areas: engineering, natural and physical sciences, human health sciences, animal health sciences, veterinary sciences, initial teaching education, masters degrees and doctorates (all subjects). The data comes from the Department of Higher Education and Training's annual reports, except for the 2024 data, which was sourced from a DHET presentation to a parliamentary committee in March 2026.
DS0362 EducationCoverage:


- South African book publishing revenue
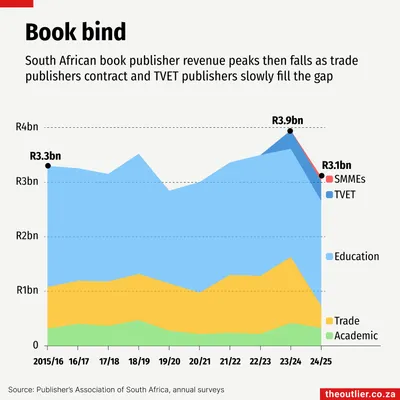
Annual book revenue by sector in South Africa. Covers sector publishing revenues.
DS0416 Economy & Business bookspublishingCoverage:
- Schools with pit toilets, not necessarily as the only form of sanitation
The number of public schools that have basic pit toilets broken down by province. Note that some schools may have appropriate sanitation as well as basic pit toilets that have yet to be removed. Basic pit toilets are 'illegal' and should have been replaced with appropriate forms of sanitation by 30 November 2016. This information comes from the Education Facilities Management System (EFMS) and its predecessor the National Education Infrastructure Management System (NEIMS). NEIMS was replaced by EFMS in 2023.
DS0341 Education educationsanitationschoolspit toiletssouth africaCoverage:
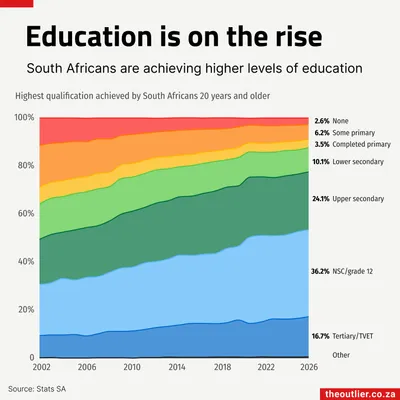
- Levels of education achieved by South Africans
The percentage distribution of the highest level of education attained by South Africans aged 20 years and older from 2002 to 2025.
DS0369 Education south africaeducationCoverage:

- Money owed to Eskom by South Africa's municipalities
Amount owed by South African municipalities to state power utility Eskom for electricity supplied. Covers financial years 2014 to 2026. Eskom's financial year starts on 1 April and ends on 31 March.
DS0104 Governance eskomlocal governmentmunicipal debtpublic financeCoverage:
- Growth rate of global atmospheric carbon dioxide
Year-on-year change in average concentration of carbon dioxide (CO2), in parts per million – or the dry air mole fraction, which is the number of moles of carbon dioxide per mole of dry air. Carbon dioxide is the most important anthropogenic greenhouse gas driving climate change. To find out more about this data go to https://www.jkclimate.fr/Dashboard2024/greenhouse_gases.html
DS0295 Climate & Environment greenhouse gasCoverage:
- Schools with basic pit toilets only
Basic pit toilets are illegal in South African schools and should have been eradicated by 31 November 2016. This datasets shows a provincial breakdown of the number of schools with basic pit toilets only. The data is sourced from the Education Facility Management System (EFMS) and its predecessor, the National Education Infrastructure Management System (NEIMS).
DS0237 Education pit toiletsschoolssouth africaCoverage:
- South African port traffic and cargo volumes
This dataset contains monthly port statistics from Transnet based on cargo dues invoiced, including total cargo, number of vessels and number of containers.
DS0093 Economy & Business shippingport statisticsmaritime transporttransnetCoverage:


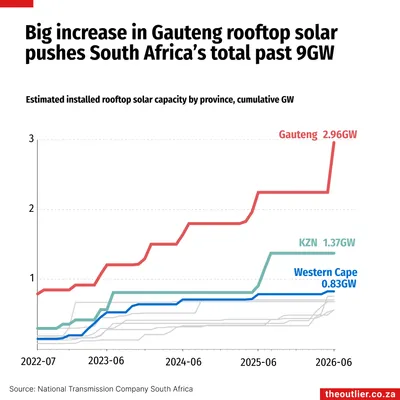
- Rooftop solar installed in South Africa
This dataset contains Eskom's estimates of rooftop photovoltaic solar capacity installed in South Africa and its nine provinces. Rooftop PV includes rooftop, ground-mounted and other behind-the-meter PV installations.
DS0099 Energy solarCoverage:

- Renewable electricity on national grid in South Africa
The annual contribution of renewable energy on the national grid in MWh as metered by the National Transmission Company South Africa (NTCSA). Renewable electricity sources are concentrated solar power (CSP), photovoltaic and wind. Most of this electricity is generated by independent power producers who have contracts with Eskom or the NTCSA. At present Eskom operates only one wind farm.
DS0225 Energy electricityeskomrenewable energyCoverage:

- Population of South Africa by age - Thembisa model
This dataset is a subset of the Thembisa Model 5.0 dataset. The model estimates or projects South Africa's population for ages 0 to 90+ from 1985 to 2035. Projections start from 2012 onwards. Go to Thembisa Project for their methodology.
DS0413 Demographics & Society populationage distributionpopulation projectionsCoverage:
- Employment in the South African mining sector
The number of people employed on average per year in the South African mining sector. The data includes the total number of employees in the mining sector overall, as well as a breakdown of the number of employees in specific mine industries: gold, platinum, coal, chrome and manganese mining. This data is from Mineral Statistics compiled by the Department of Mineral Resources and Energy.
DS0175 Economy & Business miningsouth africaCoverage:
- Voter registration, turnout in South Africa's local government elections, province level
The number of registered voters, the number that voted (voter turnout) and the percentage that voted (% voter turnout) in South Africa's local government (aka municipal) elections, from 2000 to 2021. This data set includes the national and provincial numbers. Local government elections are held every five years.
DS0360 Governance south africaelectionsCoverage:

-
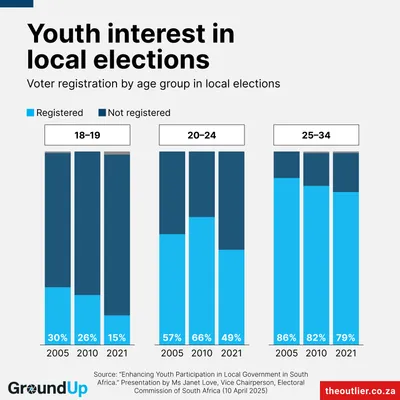
Youth voter registration self-reporting rates in South Africa across three survey years (2005, 2010, and 2021). The dataset breaks down registration status (registered, not registered, and undisclosed) across three youth age brackets: 18-19, 20-24, and 25-34. Based on research presented by the Electoral Commission of South Africa (IEC).
DS0391 Politics & Elections south africaelectionsyouth votevoter registrationelectoral participationCoverage:
- Carbon tax rates in South Africa, 2019-2030
South Africa's carbon tax rate in rands per tonne of carbon dioxide equivalent (tCO2e) as well the percentage of tax-free allowances for industrial process and fugitive emissions and combustion emissions and the tax rate after allowances have been deducted.
DS0310 Climate & Environment carbon taxclimate changegreenhouse gas emissionssouth africaCoverage:
-
Africa's top car producers
DS0300 Economy & Business africacarsmotor vehiclesCoverage:

- Taxpayers versus grant recipients in South Africa, 2017/18 to 2025/26
The number of registered taxpayers in South Africa with income over the taxable threshold and the number with income of R750,000 and above as well as the number of grant beneficiaries by financial year since 2017/18. The data is sourced from the National Treasury's annual Budget Review documents.
DS0234 Economy & Business taxsouth africabudgetCoverage:
- Gold produced in South Africa, by year
South Africa's annual gold production. Data was provided by the South African Department of Mineral Resources and Energy.
DS0186 Economy & Business mininggoldsouth africaCoverage:
- Cape Town MyCiti bus passenger journeys
The number of passenger journeys per financial year on Cape Town's MyCiti buses. MyCiti is a public transport service run by the City of Cape Town. The city's financial year begins on 1 July.
DS0147 Transport & Infrastructure cape townsouth africaCoverage:
-
The consumer price index (CPI) is the official measure of inflation in South Africa. This dataset provides the annual average Consumer Price Index per year in percentages
DS0270 Economy & Business cpiconsumer pricesouth africaCoverage:
- Schools with pit toilets not on SAFE list
This dataset contains 447 public schools that have pit latrines as at 31 July 2025, according to information supplied to parliament by the Department of Basic Education in January 2026. These are schools not covered in the SAFE Initiative programme, according to the DBE. However, 17 schools in this list are on the SAFE Initiative list.
DS0396 Education educationpit toiletsschoolssouth africaCoverage: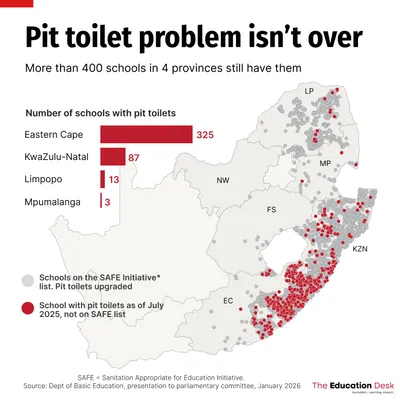
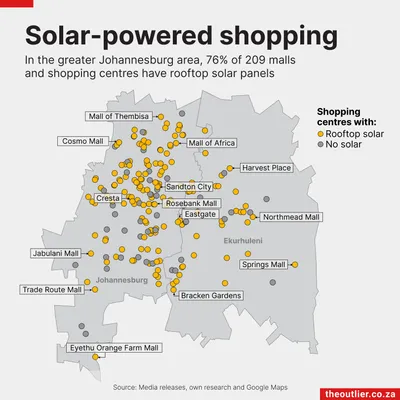
- Rooftop solar installations: Johannesburg and Ekurhuleni
Presence of rooftop solar PV installations across 209 shopping centres and malls in Johannesburg and Ekurhuleni as of 2026. Includes installation status (installed or not installed) and verification method. Compiled by DataDesk using media releases and Google Maps satellite imagery.
DS0372 Economy & Business solarsouth africajohannesburgrenewable energyrooftop solarshopping centresCoverage: